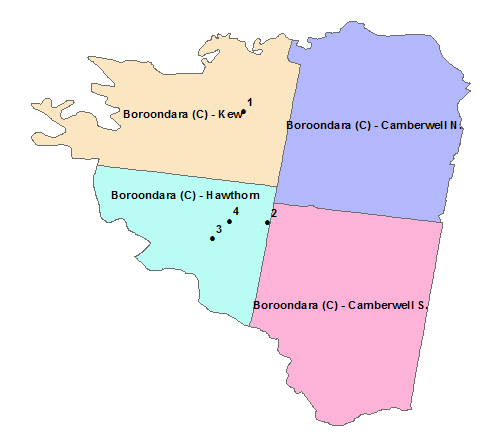
Net EGM expenditure is the total amount lost by players.
| Financial Year | 2024/25 | 2024/23 |
$ | $ | |
| July August September October November December January February March April May June | 1,703,740.28 1,639,682.31 1,605,412.26 1,740,685.53 1,698,041.72 0.00 0.00 0.00 0.00 0.00 0.00 0.00 | 1,523,618.03 1,600,759.98 1,468,497.91 1,569,164.21 1,706,619.89 1,593,702.08 1,645,632.39 1,522,555.47 1,633,888.47 1,510,834.98 1,526,589.84 1,503,499.69 |
TOTAL | $8,387,562.10 | $18,805,362.94 |
PLEASE NOTE that the "Monthly Net Electronic Gaming Machine Expenditure" amount appearing above is based on data that may not have been fully audited to date. Any changes are unlikely to have a material effect on the figures provided.
The data is audited on an ongoing basis during each financial year to produce the annual net expenditure amount appearing above.
