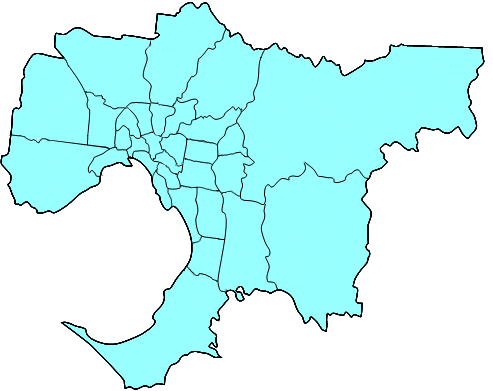
Click on a Local Government Area in the map or the text links below to access information about the gaming venues located there.
Find a gaming venue in Country Victoria.
Select from the list below to go to any Metropolitan gaming venues.
| Expenditure Data 2011 - 2012 (all figures as at 30 June 2012) | |||||
2012 Population (18+) Projection | VENUE NO | EGM NO | TOTAL NET EXPENDITURE 2011-12 | ||
| Metropolitan Total | 3,303,370 | 324 | 19,376 | $2,107,449,564.20 | |
| Victorian Total | 4,456,675 | 509 | 26,778 | $2,681,451,714.71 | |
Population (18+) per venue | Net EGM expenditure per adult | EGM per 1000 (18+) | ||
| Metropolitan | 10,196 | $638 | 5.87 | |
| Victoria | 8,756 | $601 | 6.00 |
Notes:
Net Expenditure is the total amount lost by players
Venue No - Expenditure Table: Calculations are based on licensed venues with EGMs - Licenced venues with zero EGMS are not included in these calculations.
EGM No - Expenditure Table: denotes the total number of electronic gaming machines licensed as at 30 June 2010.
EGM - Map Table: denotes the number of electronic gaming machines for current licensed venues. This information is updated regularly.
Source of Population Figures: Department of Planning and Comminuty Development, Victoria in Future 2008, population projections by single year based on age and sex for each Local Government Area (LGA) as at 30 June 2010.
Disclaimer: Care must be taken in using any figures for an LGA involving net expenditure and population.
The expenditure per person in an LGA has not taken into account the amount of expenditure coming from persons not residential to the LGA.
Please note that the statistical information previously found on this web page is now available in the excel spreadsheet located on the Data Web Page.